I was recently looking into a heat transfer problem for a client using CFD-ACE+ and had a need to scale out to run some parameter sweeps on the two-dimensional time dependent problem. As with most things I like to experiment first to try for an efficient method – particularly when I’m running on AWS with per second billing.
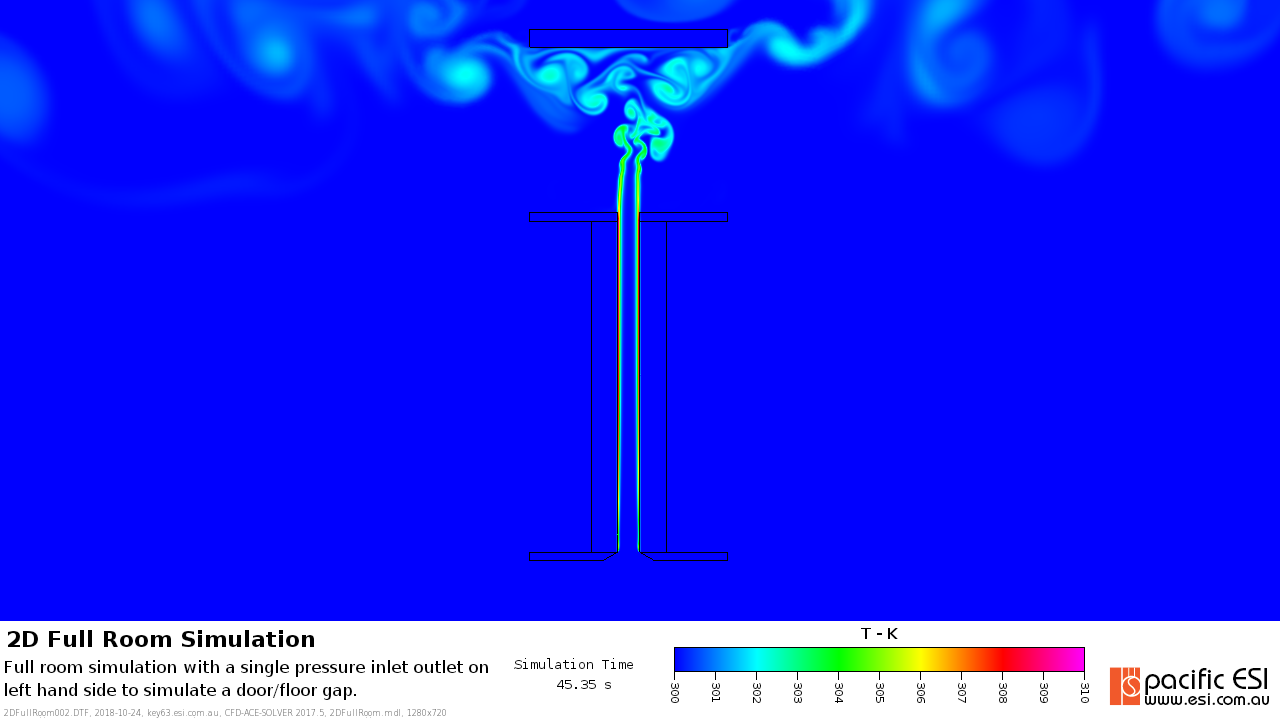
Incidentally, the problem is actually quite interesting and looking at the effect of boundary conditions on natural convection against benchmark laboratory experiments, see below. I think that work will be another post by itself, if not a full paper later.
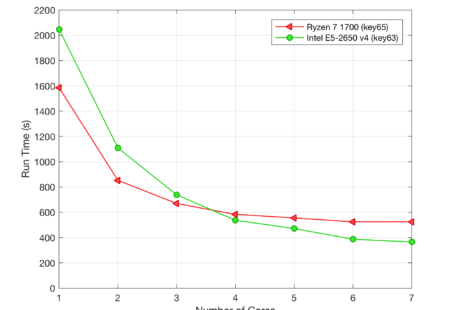
Anyway, as I was distributing jobs over spot C5 nodes that terminate on finish my first attempt was to push the jobs out over the AWS EFS (their NFS essentially) so that if (when) my spot nodes terminated I didn’t loose any data. For reference, the benchmark here is my venerable but still lovely E5-2650 v4 that we run locally on site. OK, in the initial glance, see below, the run times look good in that I’m good reductions as the core count increases.
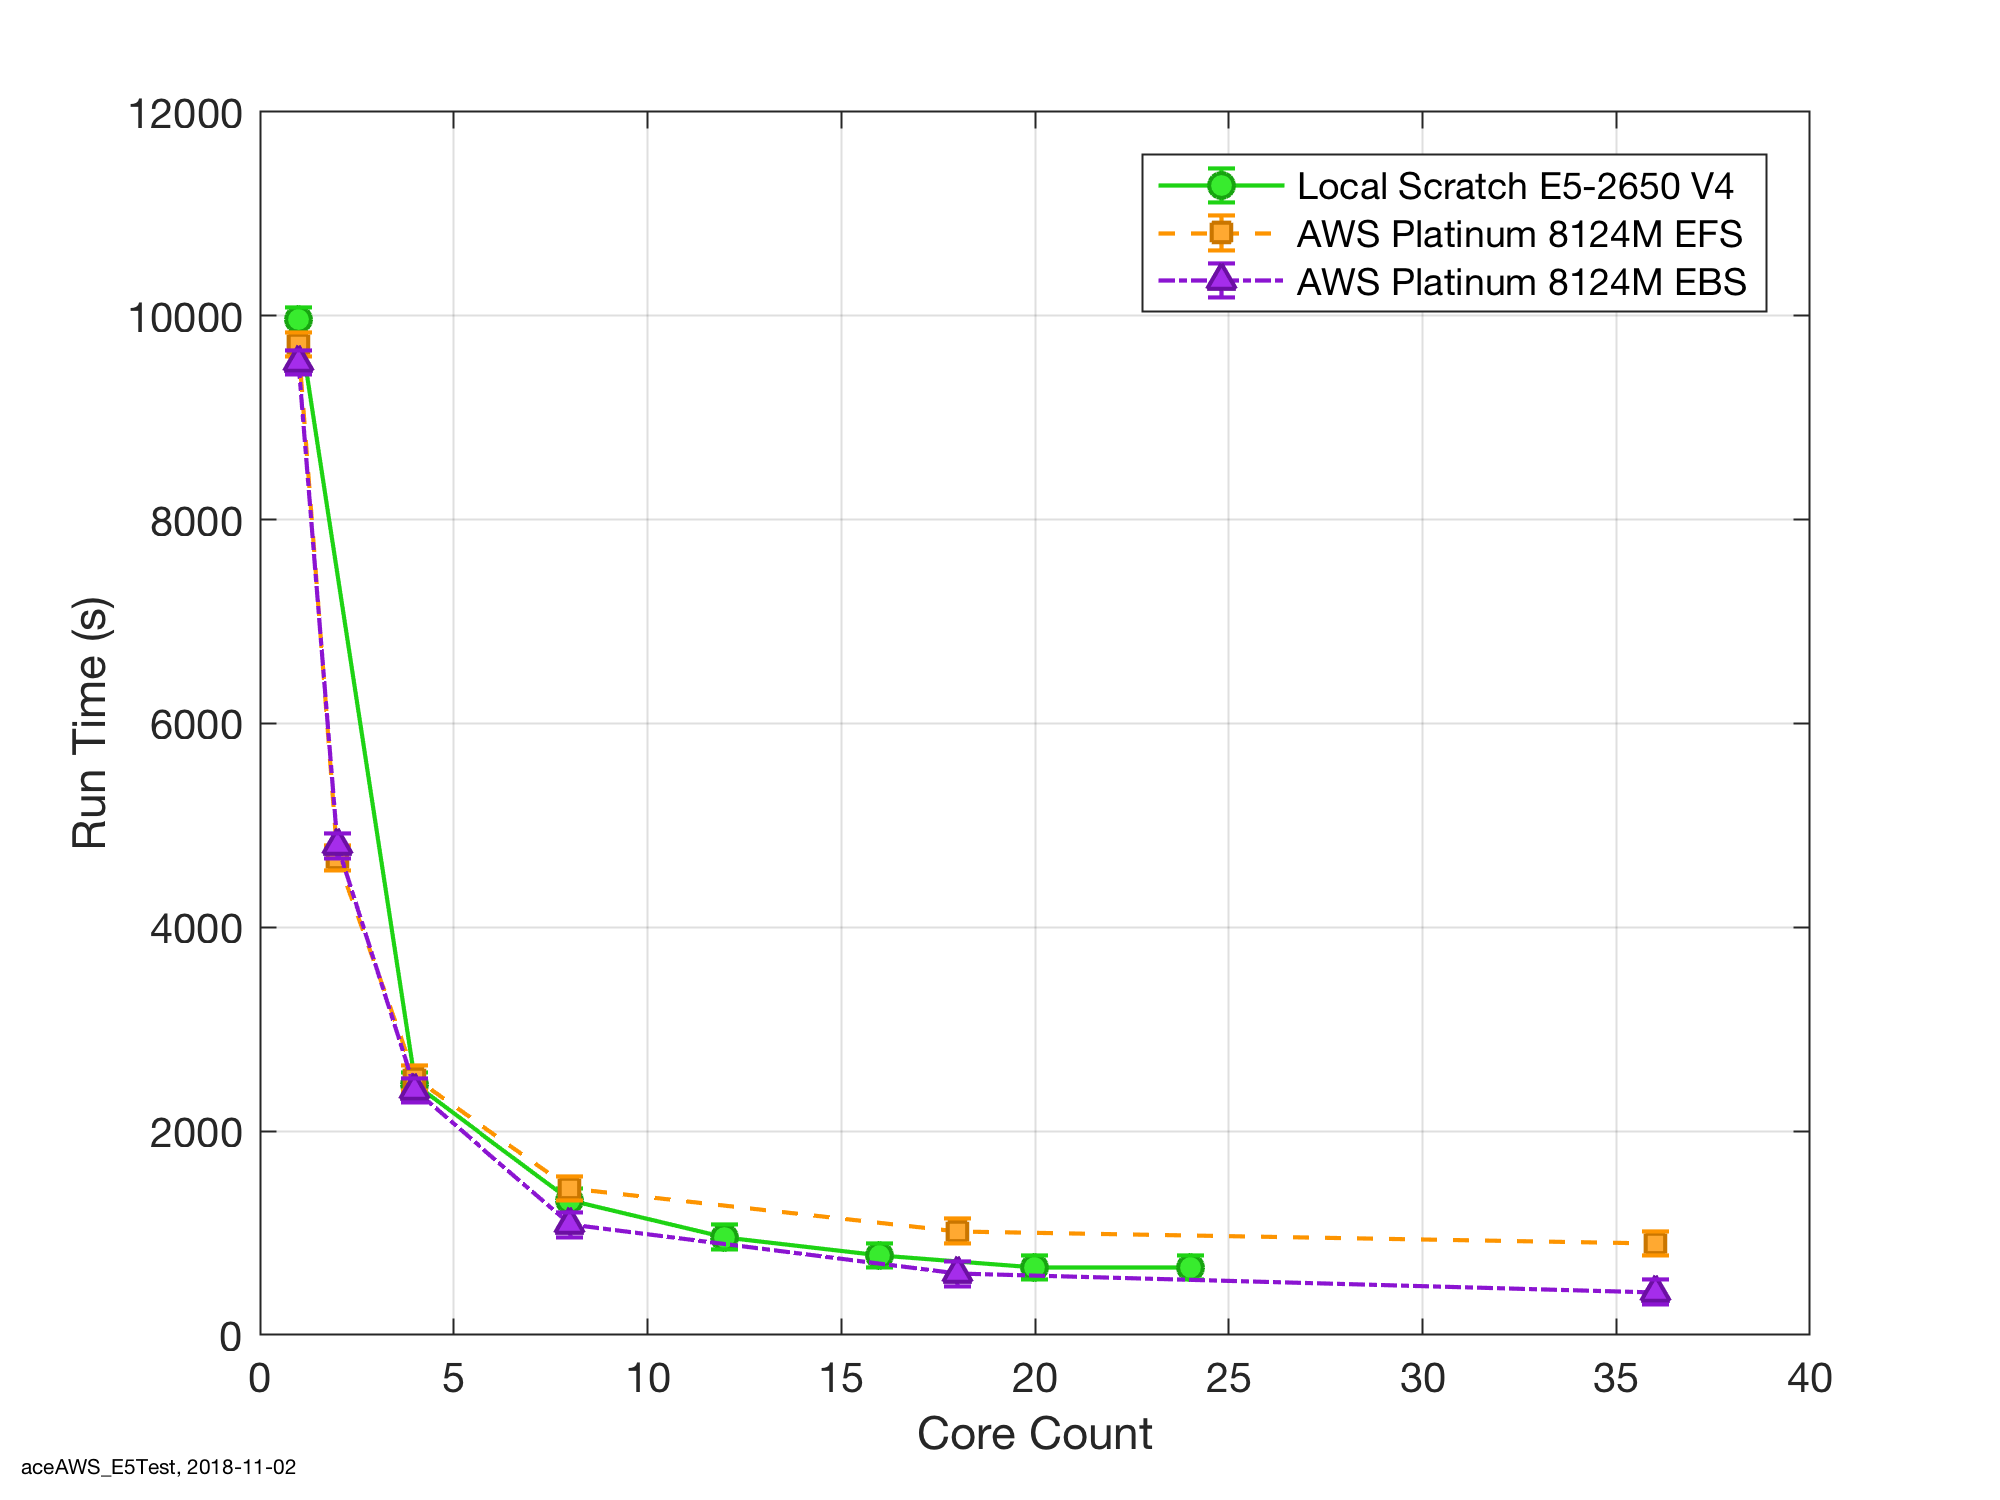
The huge caveat though is that the scale out performance is significantly lower than my E5. See above with the high run times and below for the scale out performance.
NB: this is what I think of as a duty cycle test: that is the run times include a combination of both CPU computation time running through the Navier-Stokes equations as well as IO time to write logs and data files for post processing. To me this is a more real-world example of performance as it is what I need in day-to-day operations.
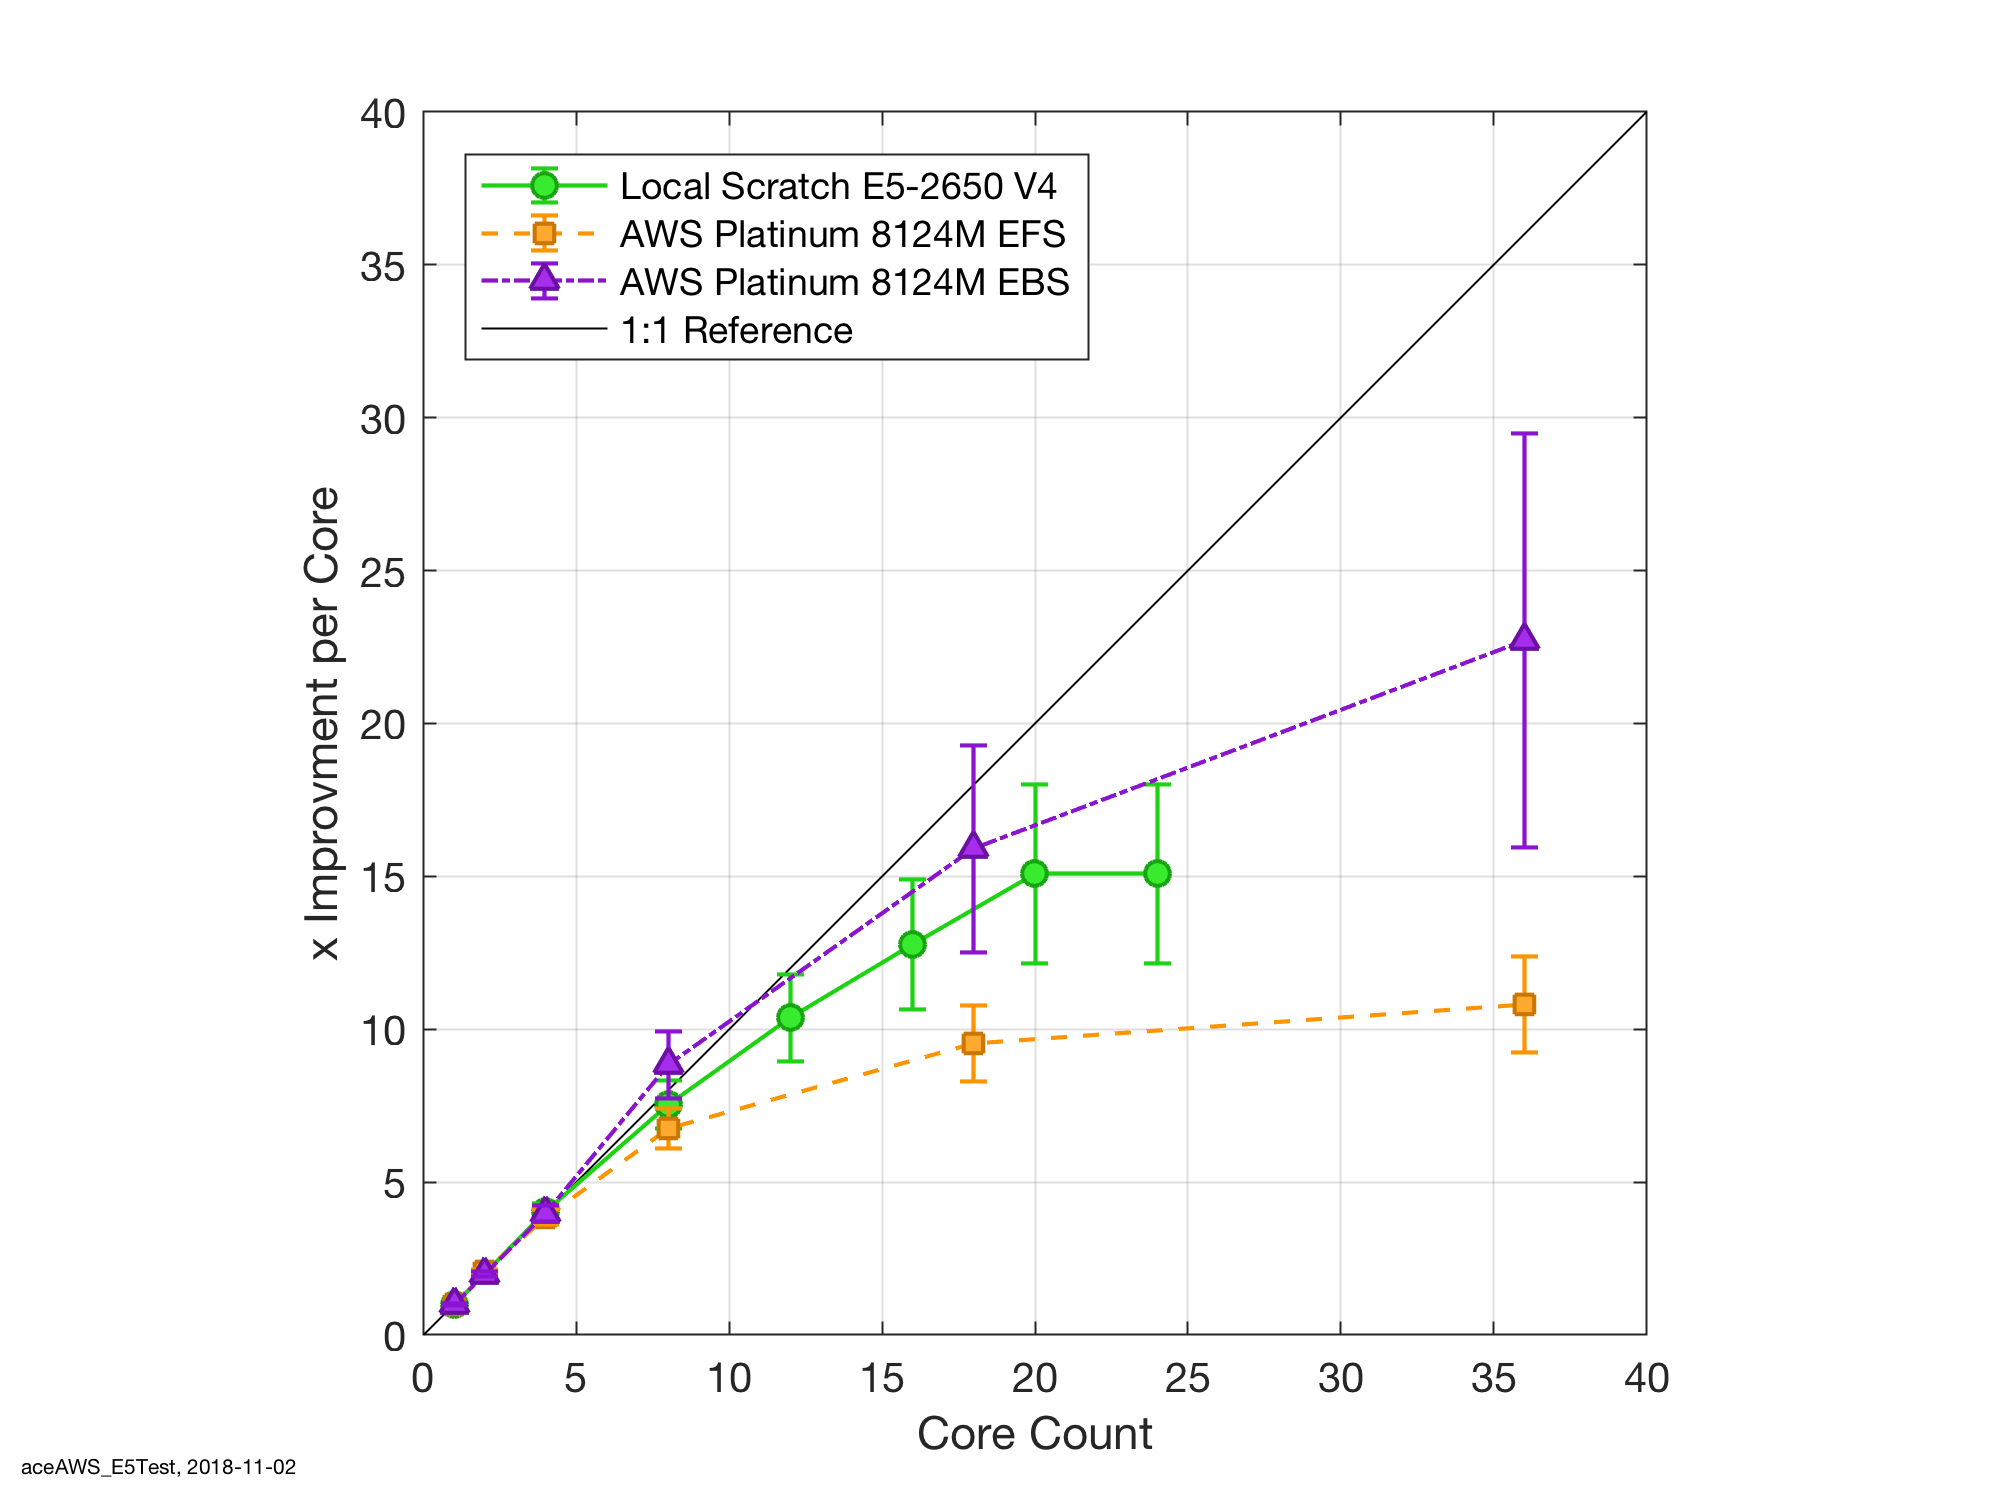
My first assumption does not look too good. To test if this was an EFS issue, I decided to not be lazy and actually rewrite my command and control process to monitor the spot status. That way I can dynamically move my data around prior to the spot node terminating and mitigate any losses.
This proved to be the turning point as can be seen on the EBS curve, which now out performs my E5 at the higher core counts. Interestingly there is no appreciable differences at the lower core counts. I suspect that this is due to the balance between clock speed, memory bandwidth saturation and IOPs.
The final feature that jumps out on the speed improvement is the apparent super-linear performance at eight cores on AWS. While I’d like this to be true its most likely a measurement error as the timing routine that I used was based on very quick and dirty coarse one-minute sampling intervals. Bummer but still you never know….
Update 1
Its been pointed out to me that this EFS throughput is perhaps a feature of EFS’s burst capability that scales with the underlying filesyste sizes. Given my data profile is write once, read later and that I actively shift data out to S2 rather than either EBS or EFS, I’ll revisit this post as my EFS file systems increase. As always: test, monitor, repeat. Thanks for the feedback.
Finally, thanks for reading this article and please leave a comment below. If you are interested in being updated when similar items are posted then either subscribe via RSS or sign up to my mailing list below.